Stockalyze AI-Powered Trading Analysis
Compare market charts across multiple timeframes and get an educational AI summary of patterns, confidence signals, and risk context. Stockalyze is the iOS app from Chart Detector.
- Multi-timeframe analysis
- Intelligent pattern recognition
- Fast insights in seconds
- Privacy-focused
Key Features
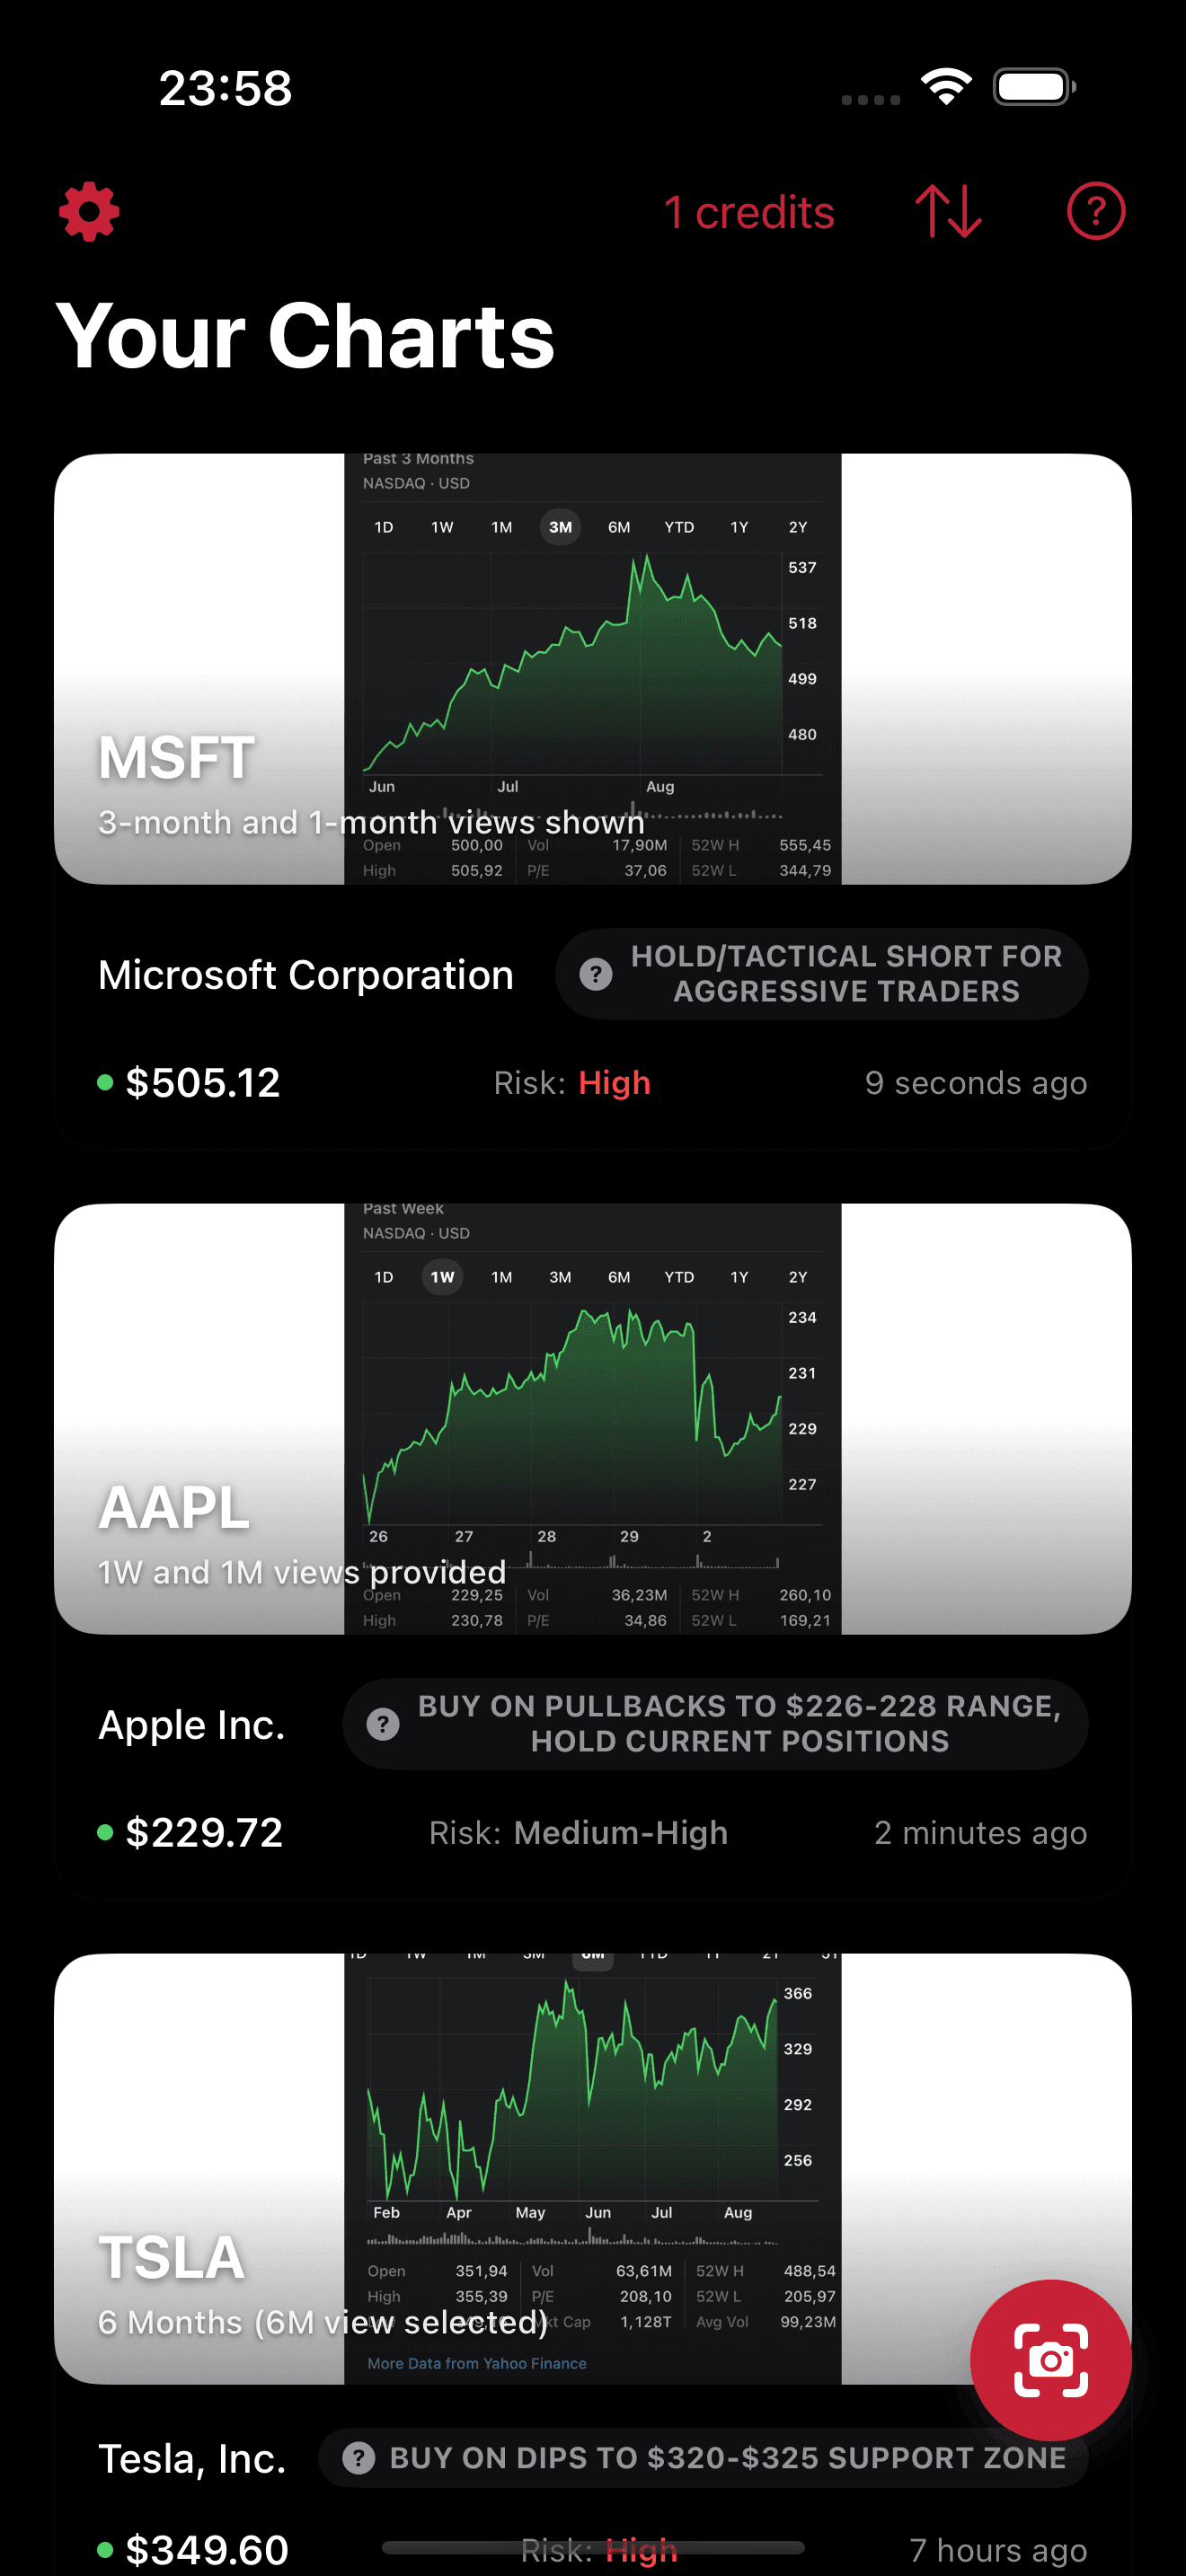
Multi-Timeframe Analysis
Upload charts from 1-week, 1-month, 3-month, and yearly views to identify optimal entry and exit points with comprehensive market context.
Personalized Recommendations
Insights adapt to your experience level, risk tolerance, and goals. Get precise buy, sell, or hold recommendations that match your style.
Intelligent Pattern Recognition
Automatically detects chart patterns, support and resistance levels, trends, and momentum indicators.
Confidence Scoring
Every signal includes a confidence score so you understand the strength of the recommendation.
Risk Assessment
Clear risk evaluation accompanies each recommendation to help manage your portfolio effectively.
Fast and Private
Analysis happens securely and quickly. Your chart data stays private.
App Screenshots
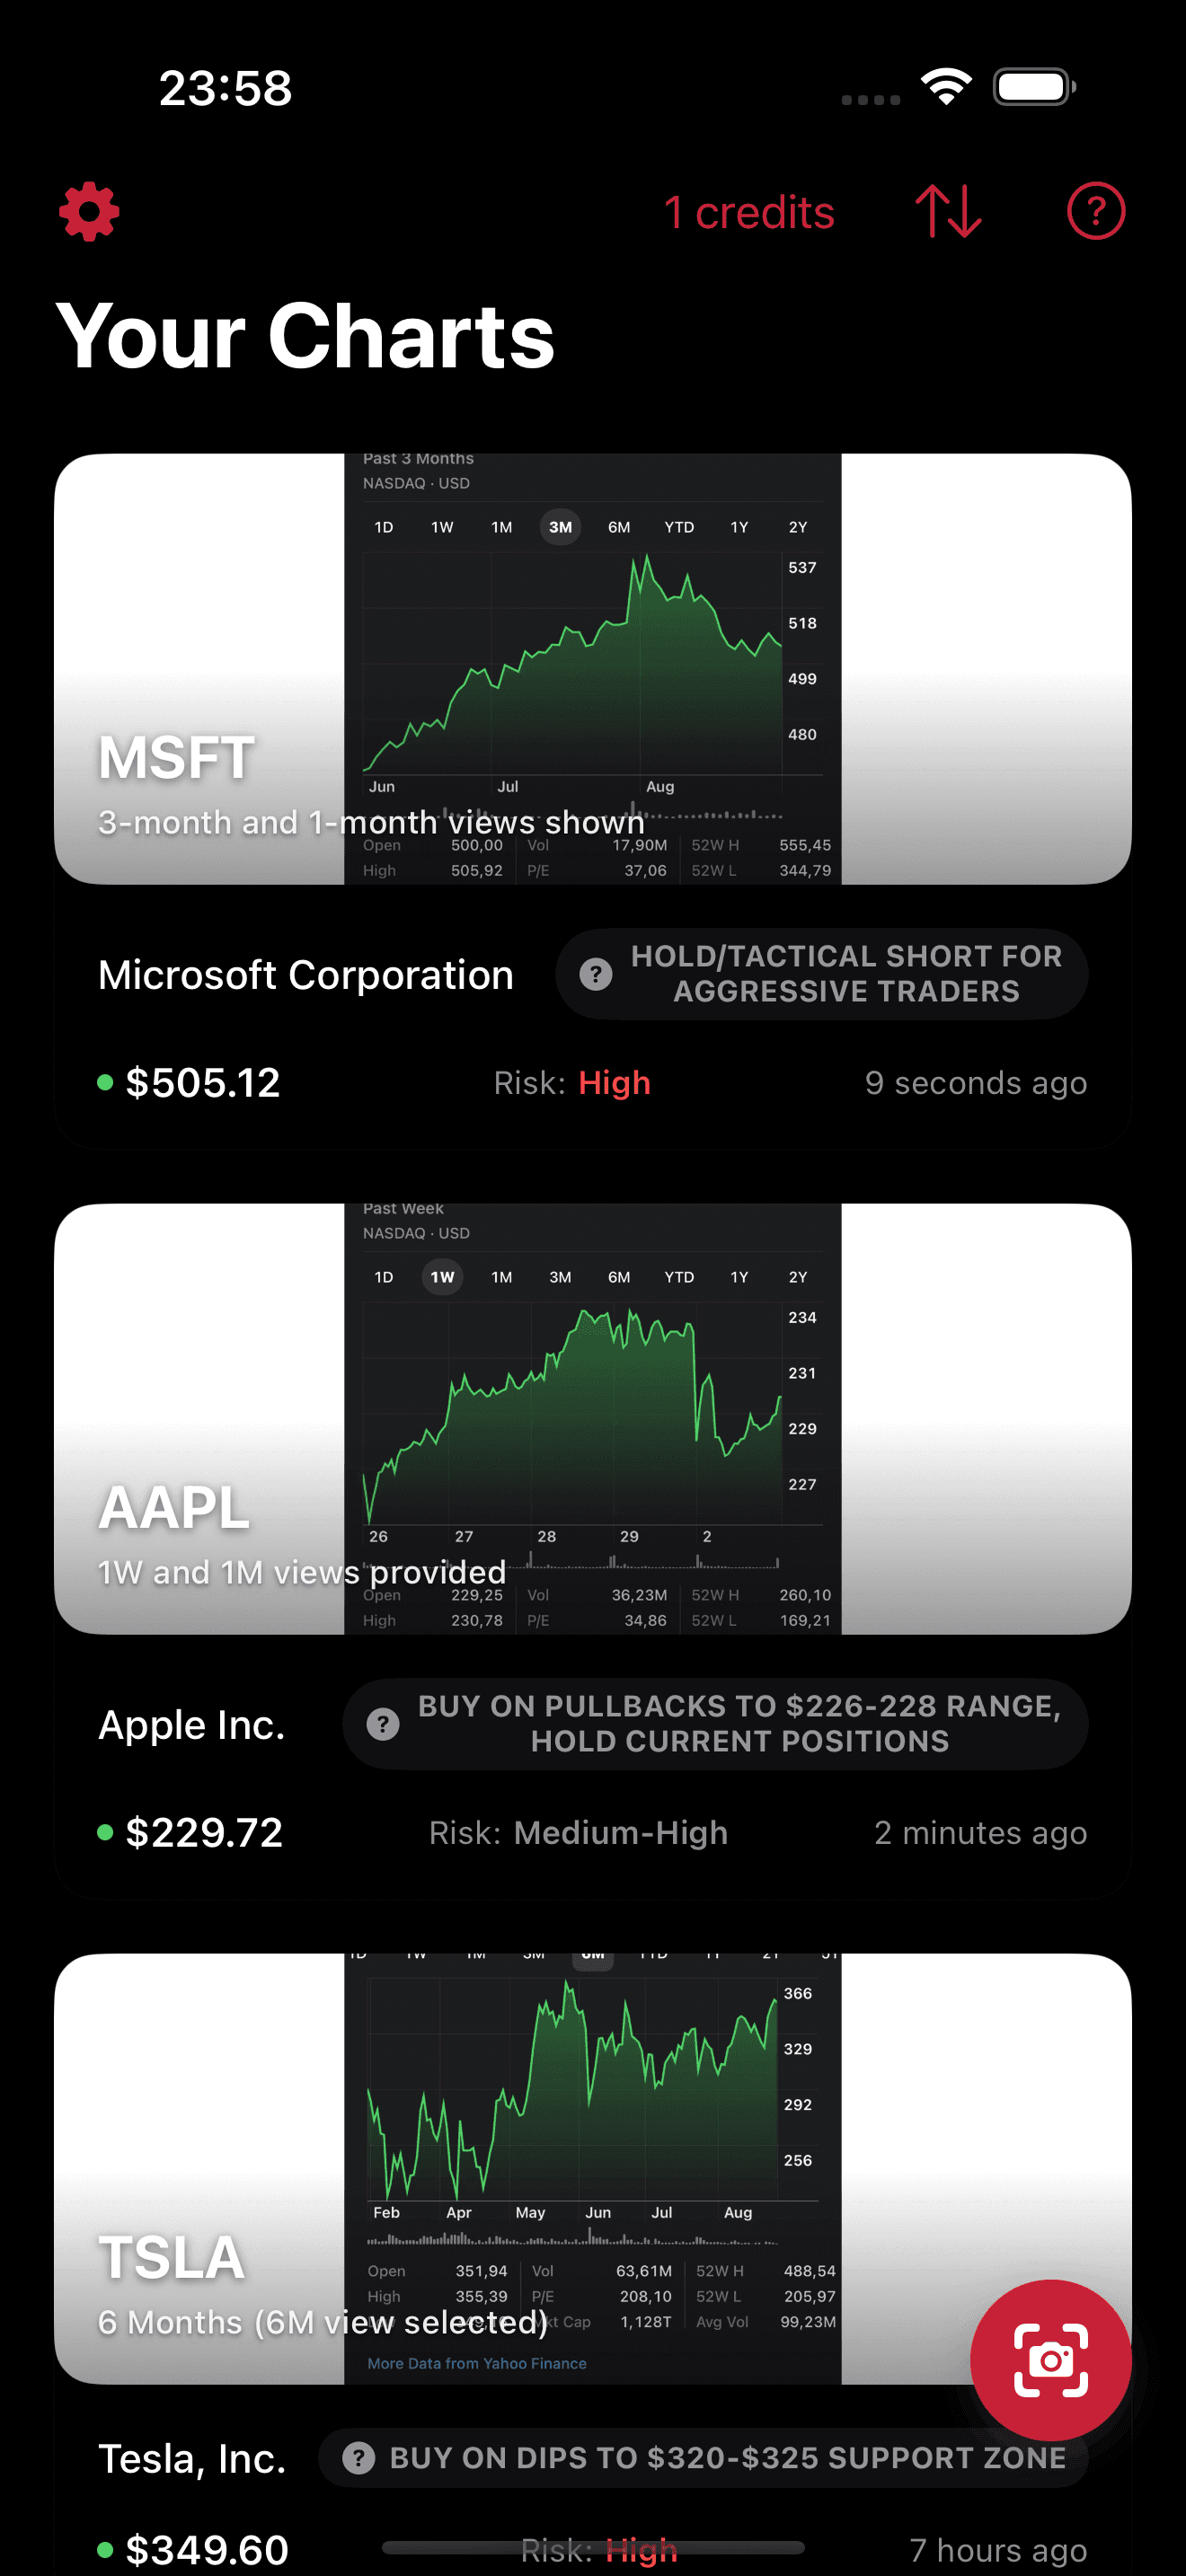
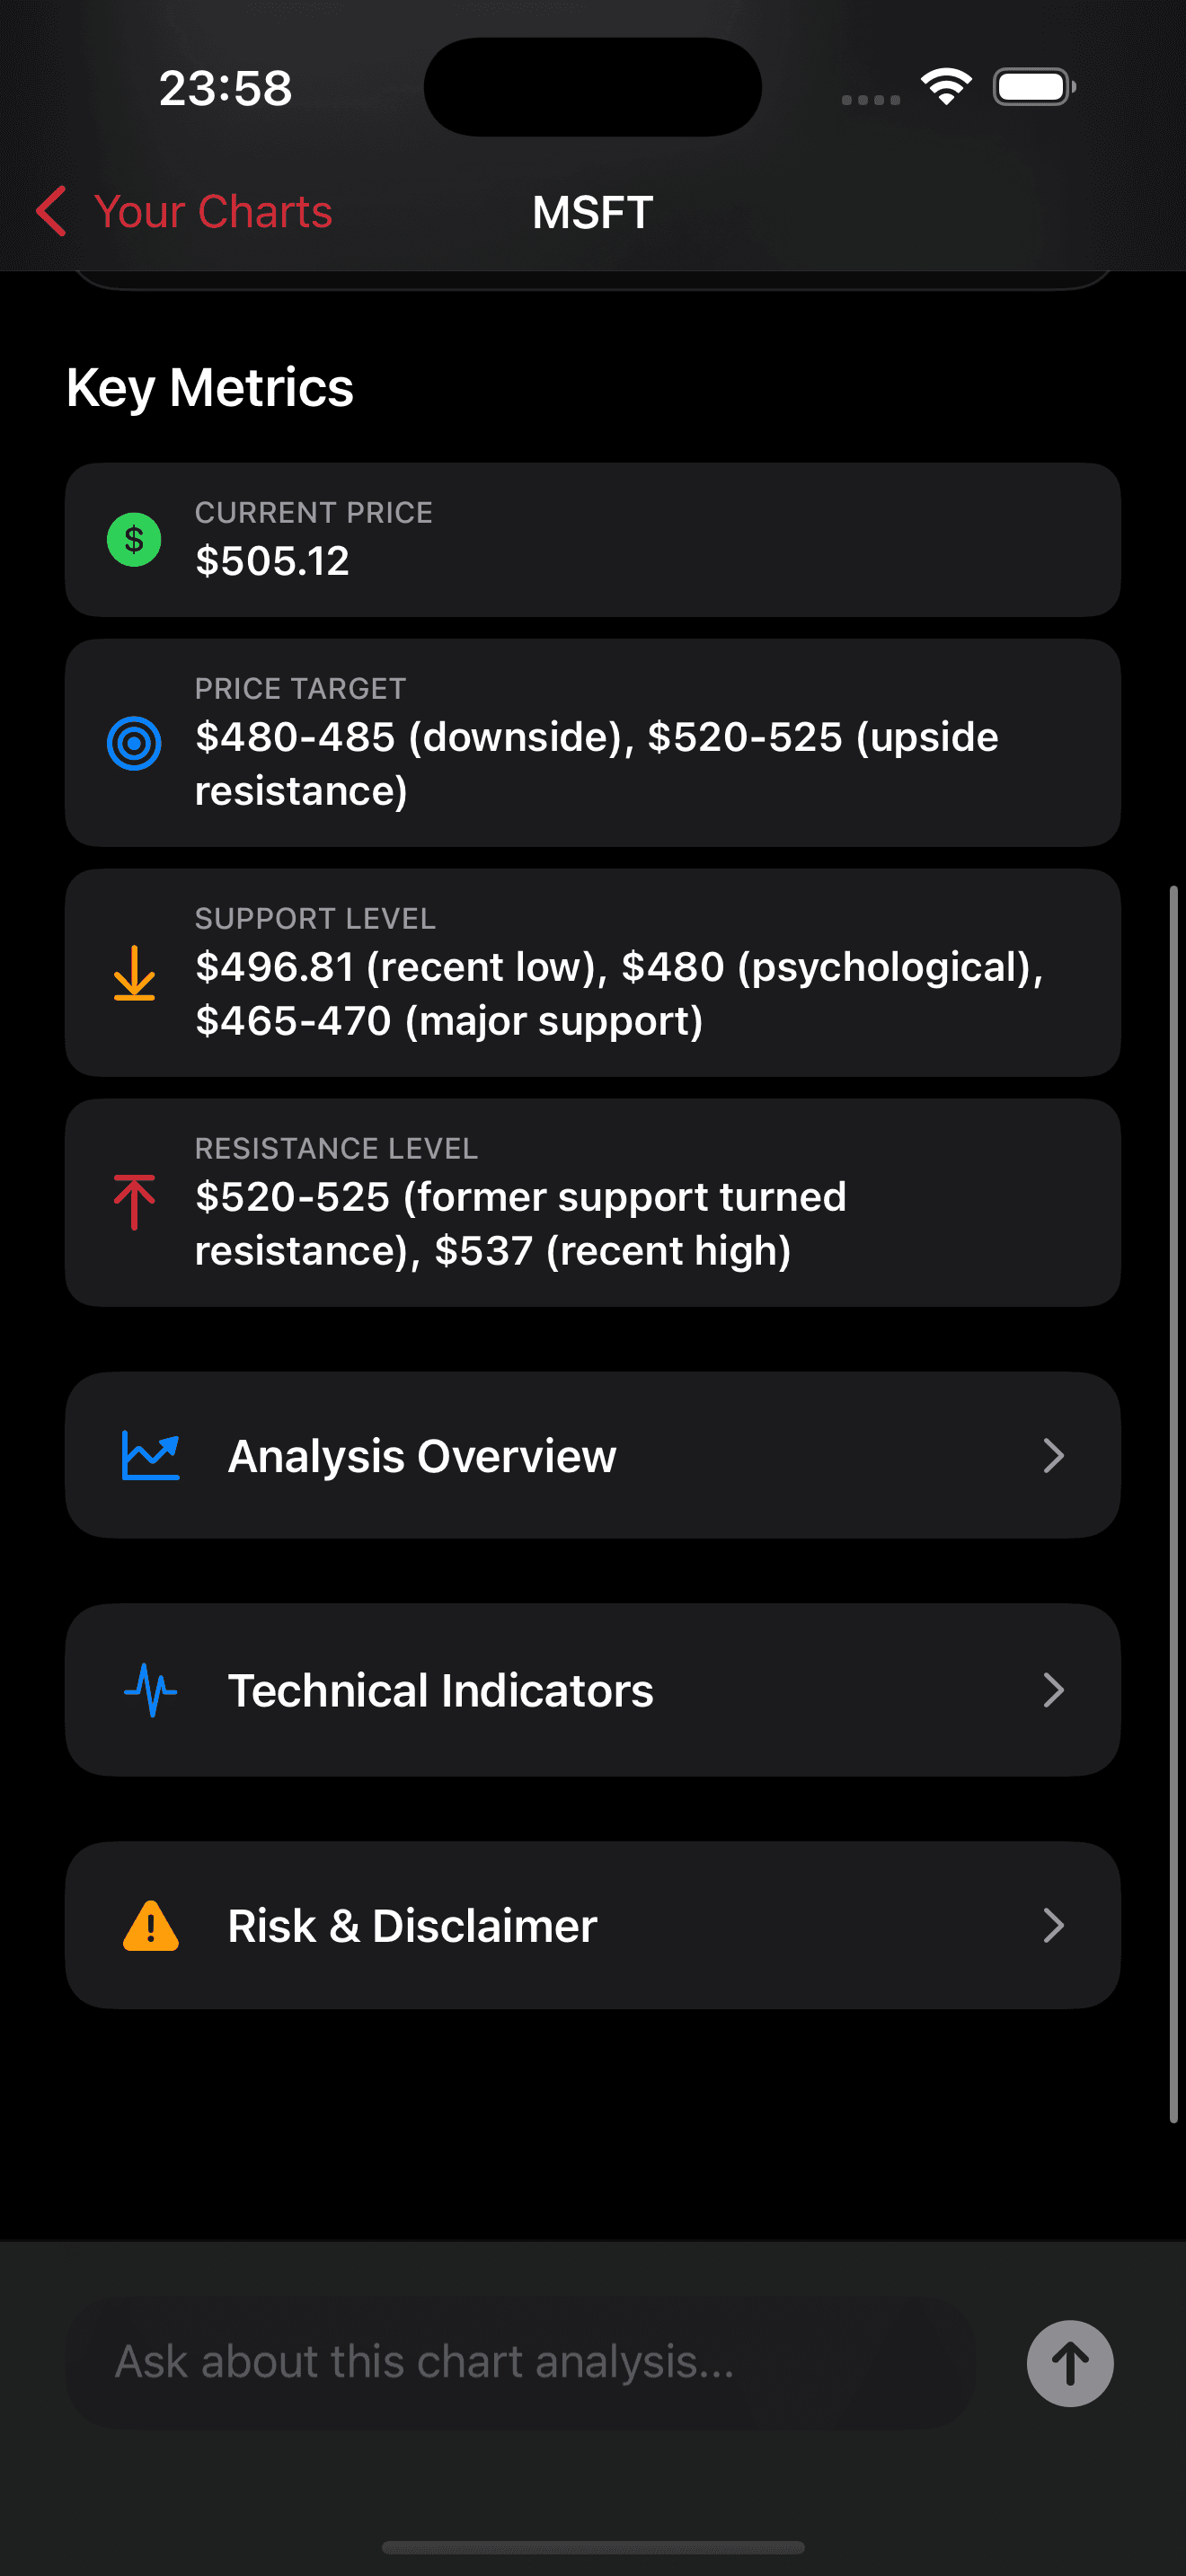
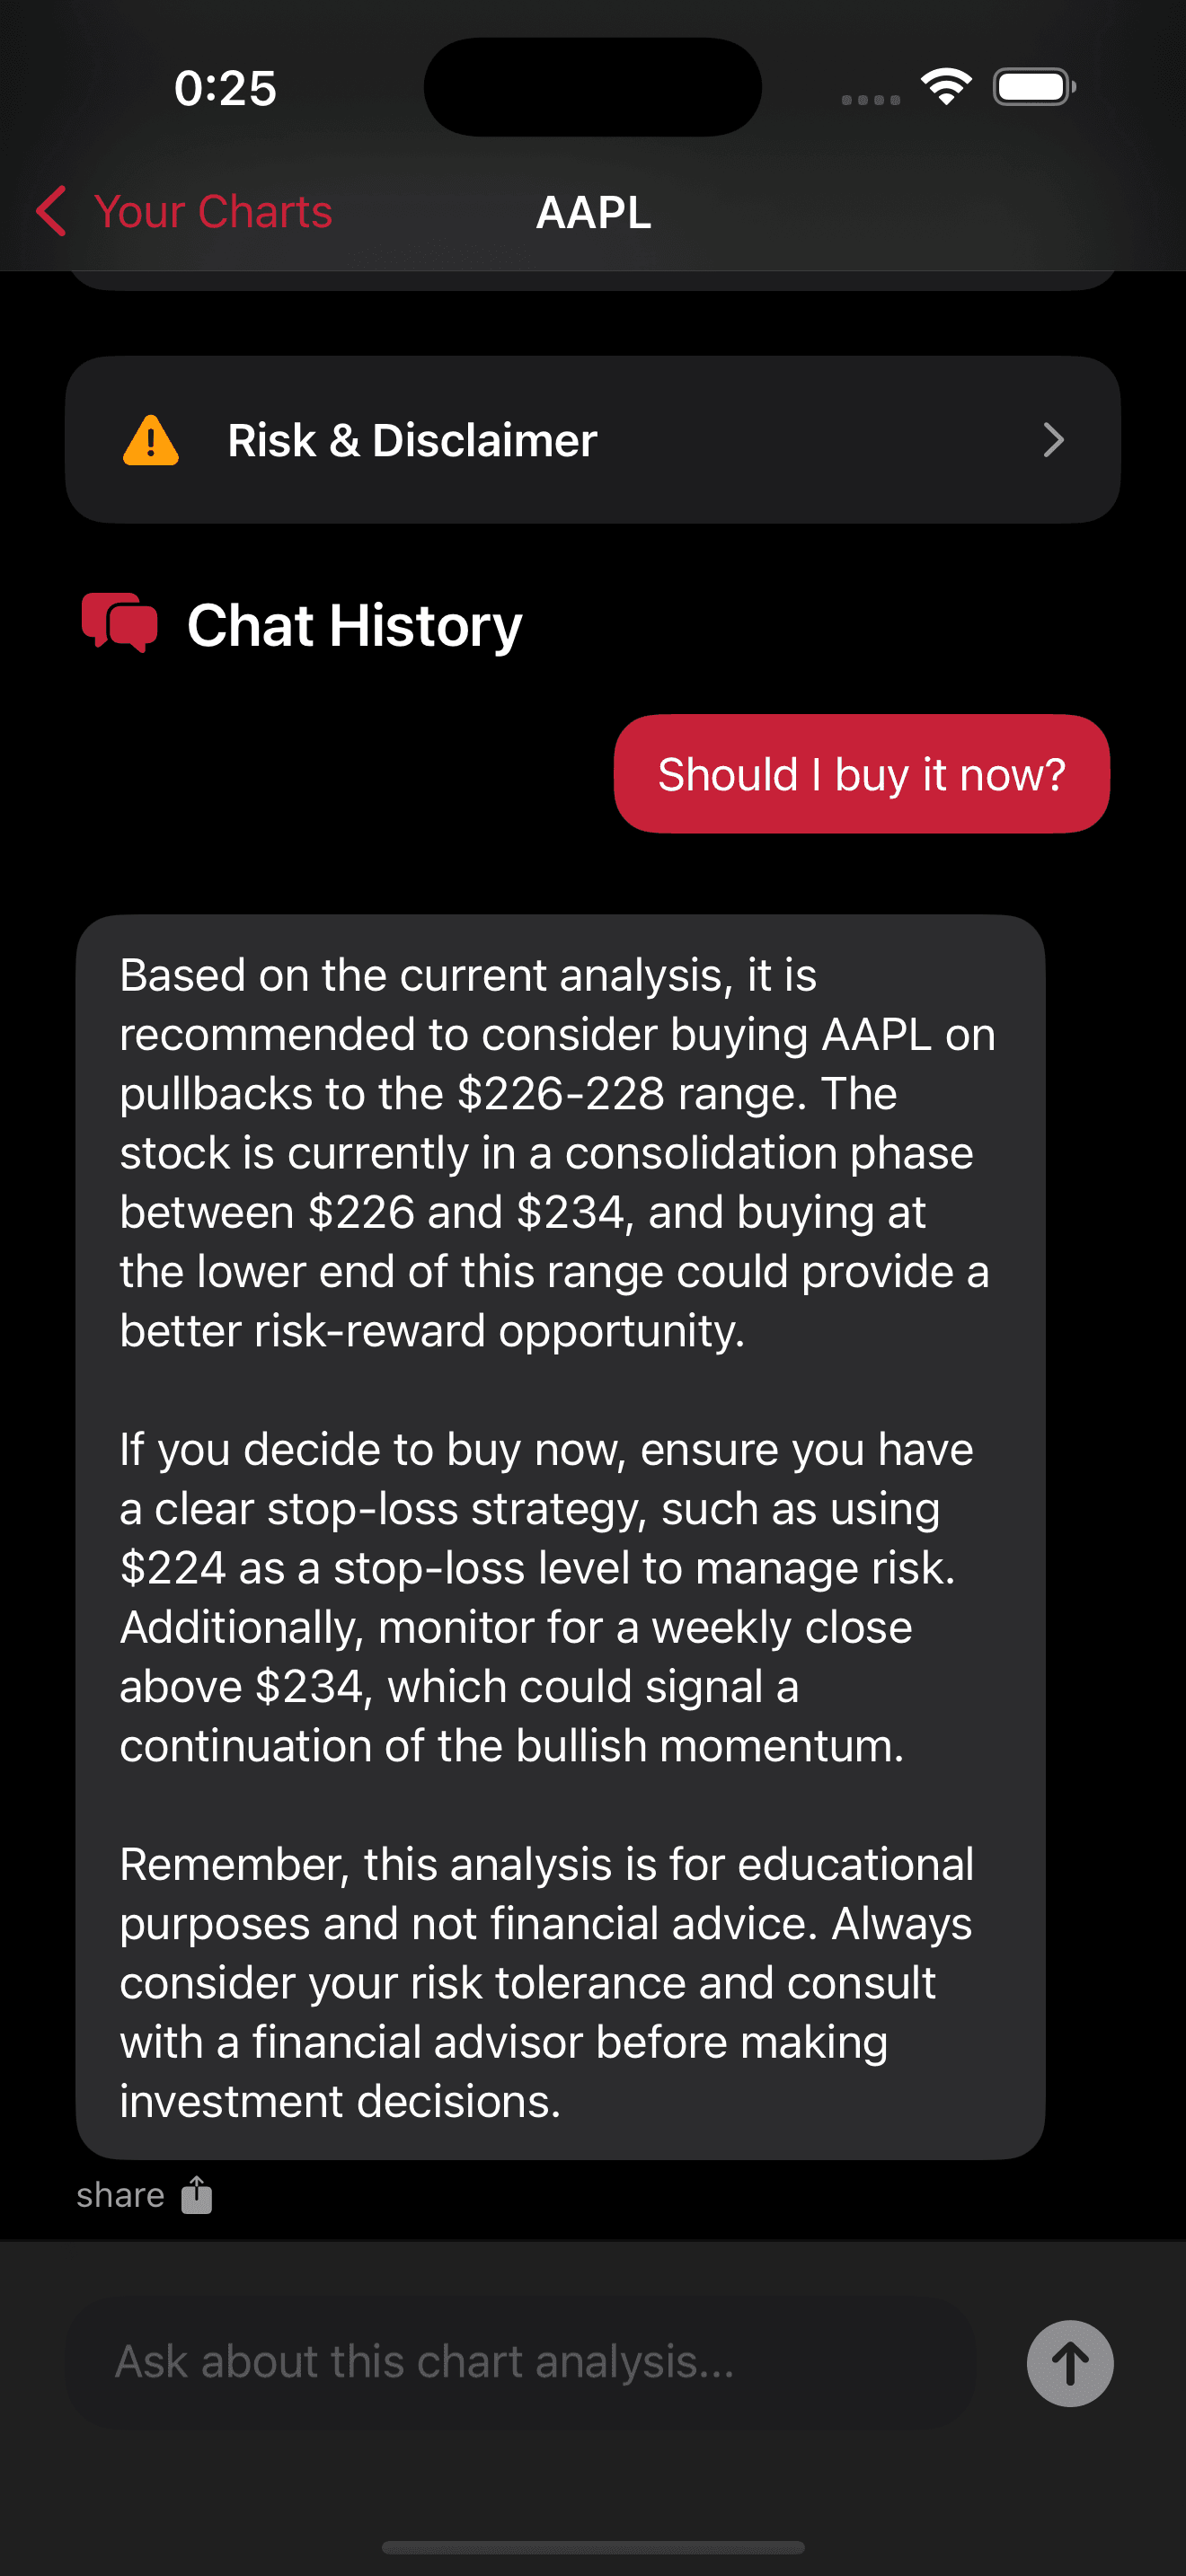
How Stockalyze analyzes a chart
Add the chart views you want to compare, choose your context, then review the educational analysis before doing your own research.
1. Add charts
Choose your timeframes
Upload chart images for the short- and long-term views you want to compare.
2. Set context
Describe your goal
Select the analysis settings that match your experience, risk tolerance, and horizon.
3. Review
Check the result
Read the detected patterns, confidence signal, and risk notes, then verify them independently.
Start analyzing charts with AI
Educational purpose only. Not financial advice.

Supported Markets
Stocks, cryptocurrency, forex, commodities, ETFs, and indices from popular platforms like TradingView and Yahoo Finance.
Day Trading
Quick analysis for short-term opportunities with precise entry timing. Perfect for active traders looking to capitalize on intraday movements.
Long-Term Investing
Strategic insights for position trading and trend following. Ideal for investors focused on building long-term wealth.
Important Disclaimer
ChartDetector provides educational content only and is not financial advice. Always conduct your own research and consider consulting qualified financial advisors before making investment decisions.
Stockalyze questions
Direct answers about chart inputs, supported markets, and responsible use.
What is Stockalyze?
Stockalyze is an iOS chart-analysis app from Chart Detector. You can upload market charts from several timeframes and receive an AI-generated educational summary of patterns, support and resistance, confidence signals, and risk context.
Which markets can Stockalyze analyze?
Stockalyze accepts charts for stocks, cryptocurrency, forex, commodities, ETFs, and indices. You can use chart images from services such as TradingView or Yahoo Finance.
Is Stockalyze financial advice?
No. Stockalyze provides educational chart analysis, not financial advice. Verify every result, do your own research, and consult a qualified financial professional before making an investment decision.
How do I analyze a chart?
Add chart images for the timeframes you want to compare, choose the analysis settings that fit your goals, and review the resulting pattern summary, confidence signal, and risk notes.